Data reduction for the Nephelometer Data
The nephelometer measures the total integrated light scattering for the measurement volume. The instrument technique is described in Middleton. The basic equation to reduce the data is:
Total Scattering = (Measurement #- Zero Value)/(Calibration # - Zero Value)*20x10-6 m-1
The instrument measures the scattering of CO2 once a week, and this is used as the calibration value. The instrument zero value is measured approximately once/hour. This zero value is a combination of a dark reading and a blank, as it is really a reading for filtered air. Each of these values must be abstracted from the data stream, and depend on the position of valves which control the air flow.
Zero Value
This analysis will handle each year separately. But first we look at some general aspects of the zero value.
Diurnal change:
To investigate whether the zero value depended on time-of-day, we plotted a series of data vs hour-of-day:

There did not appear to be any systematic change in this reading through the day, so we could ignore this factor. However there is a significant change over a longer period, as discussed below.
2006
2007
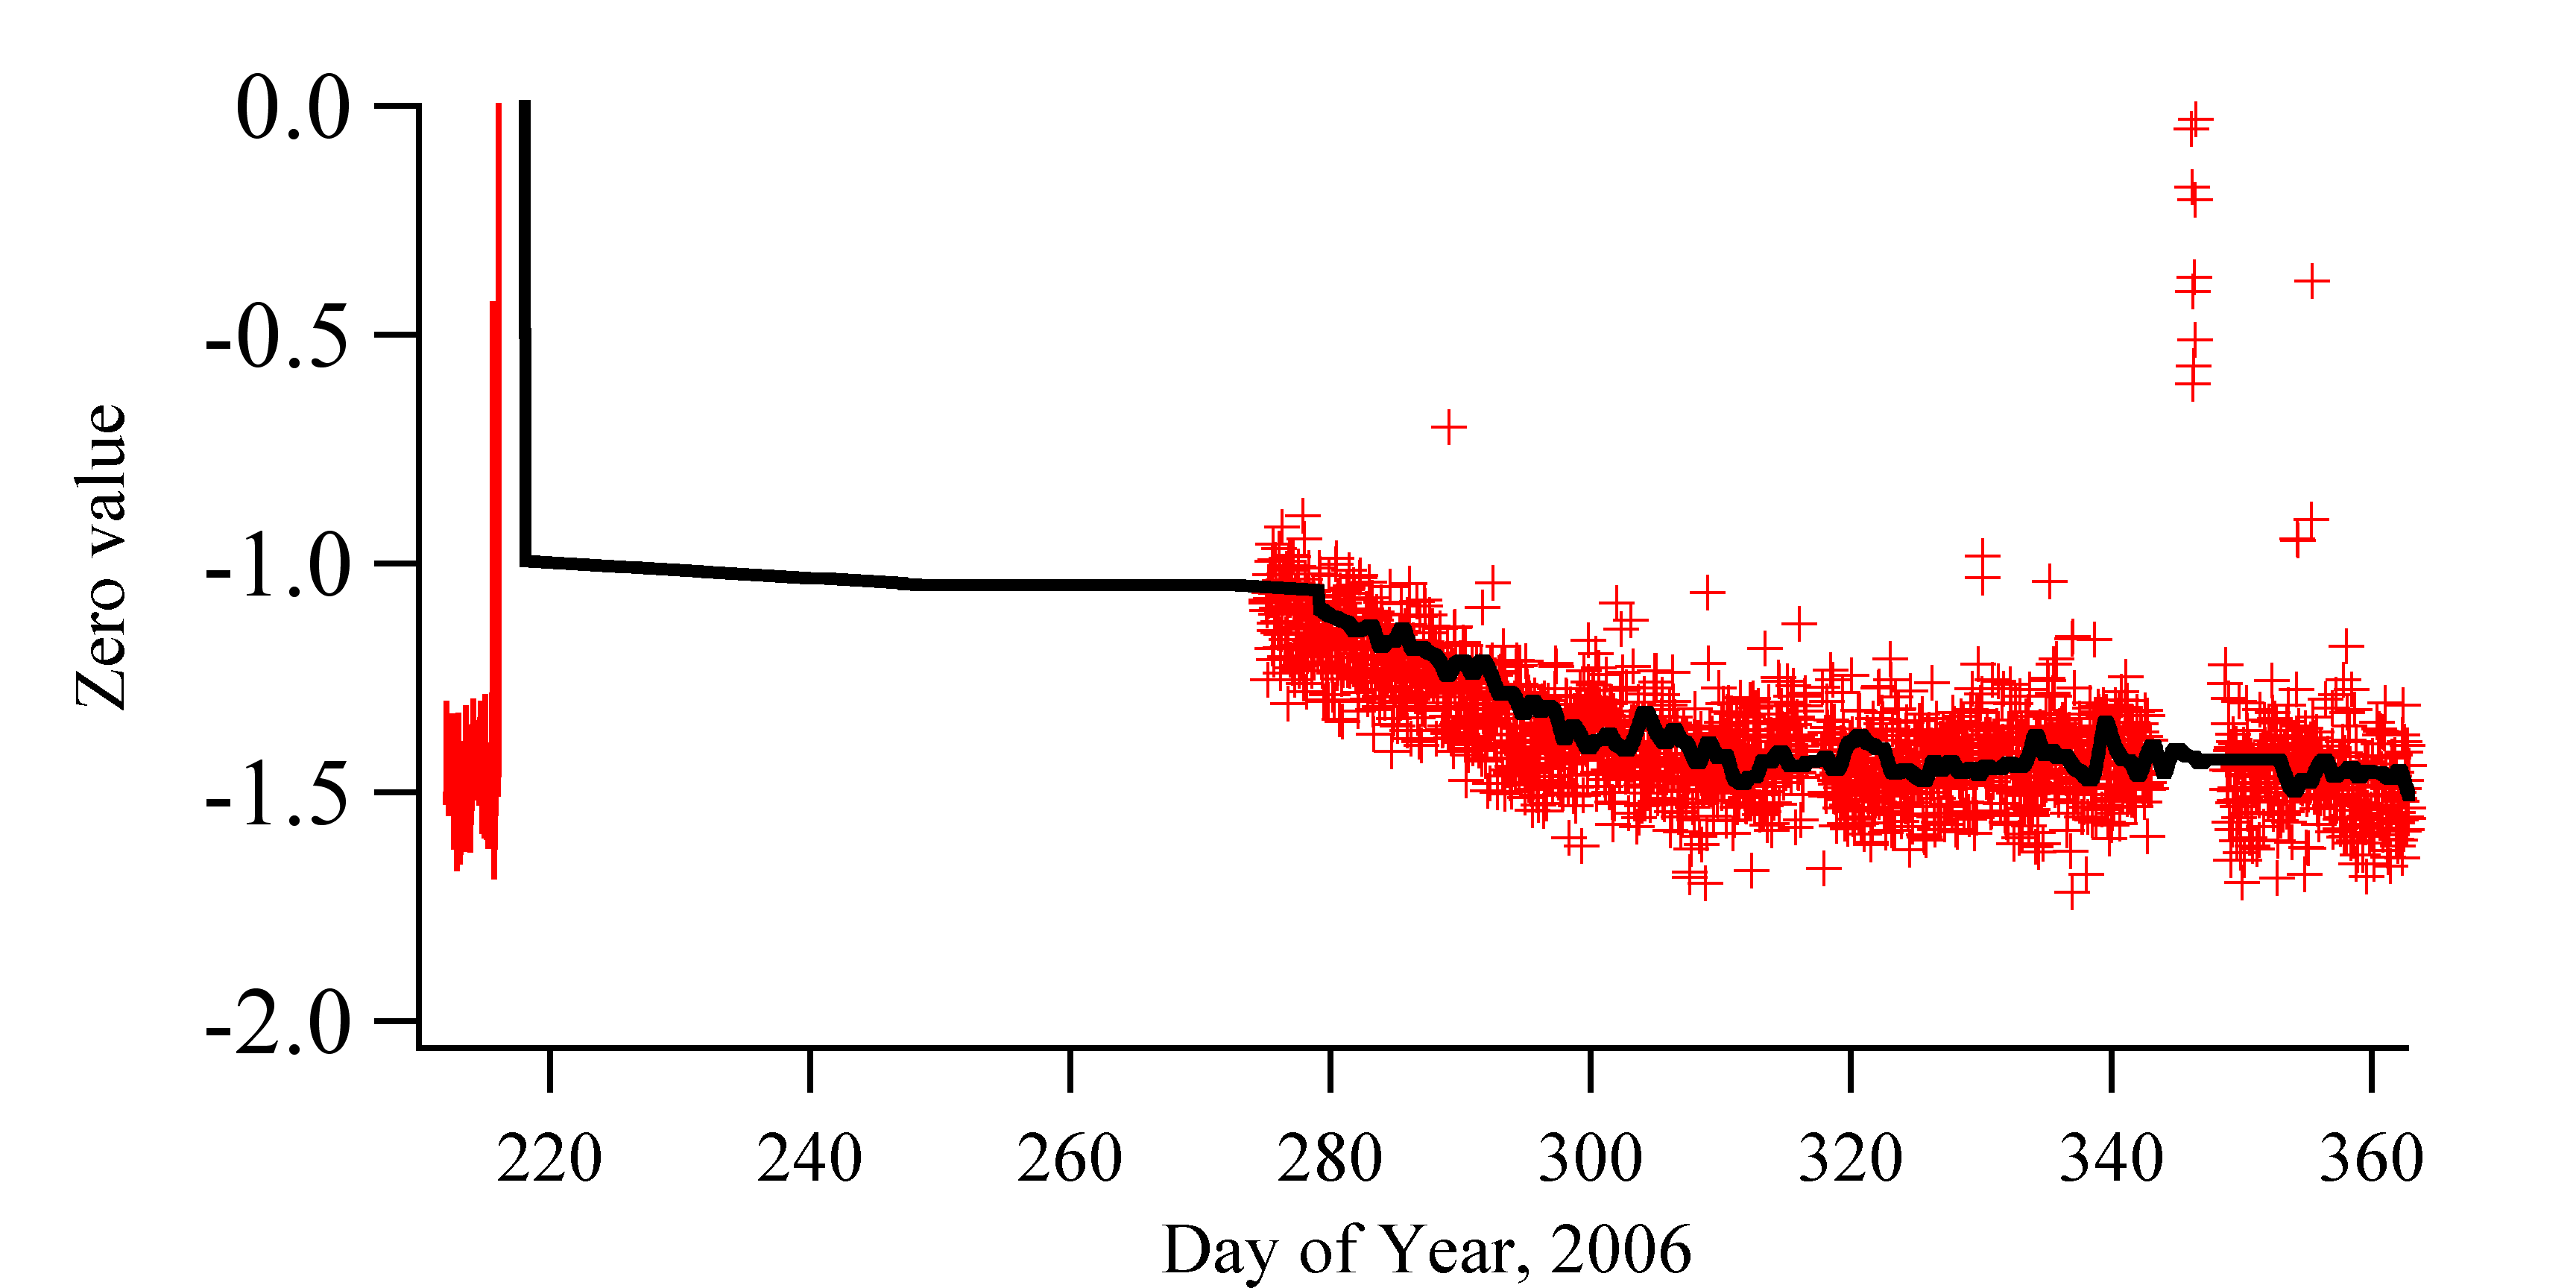
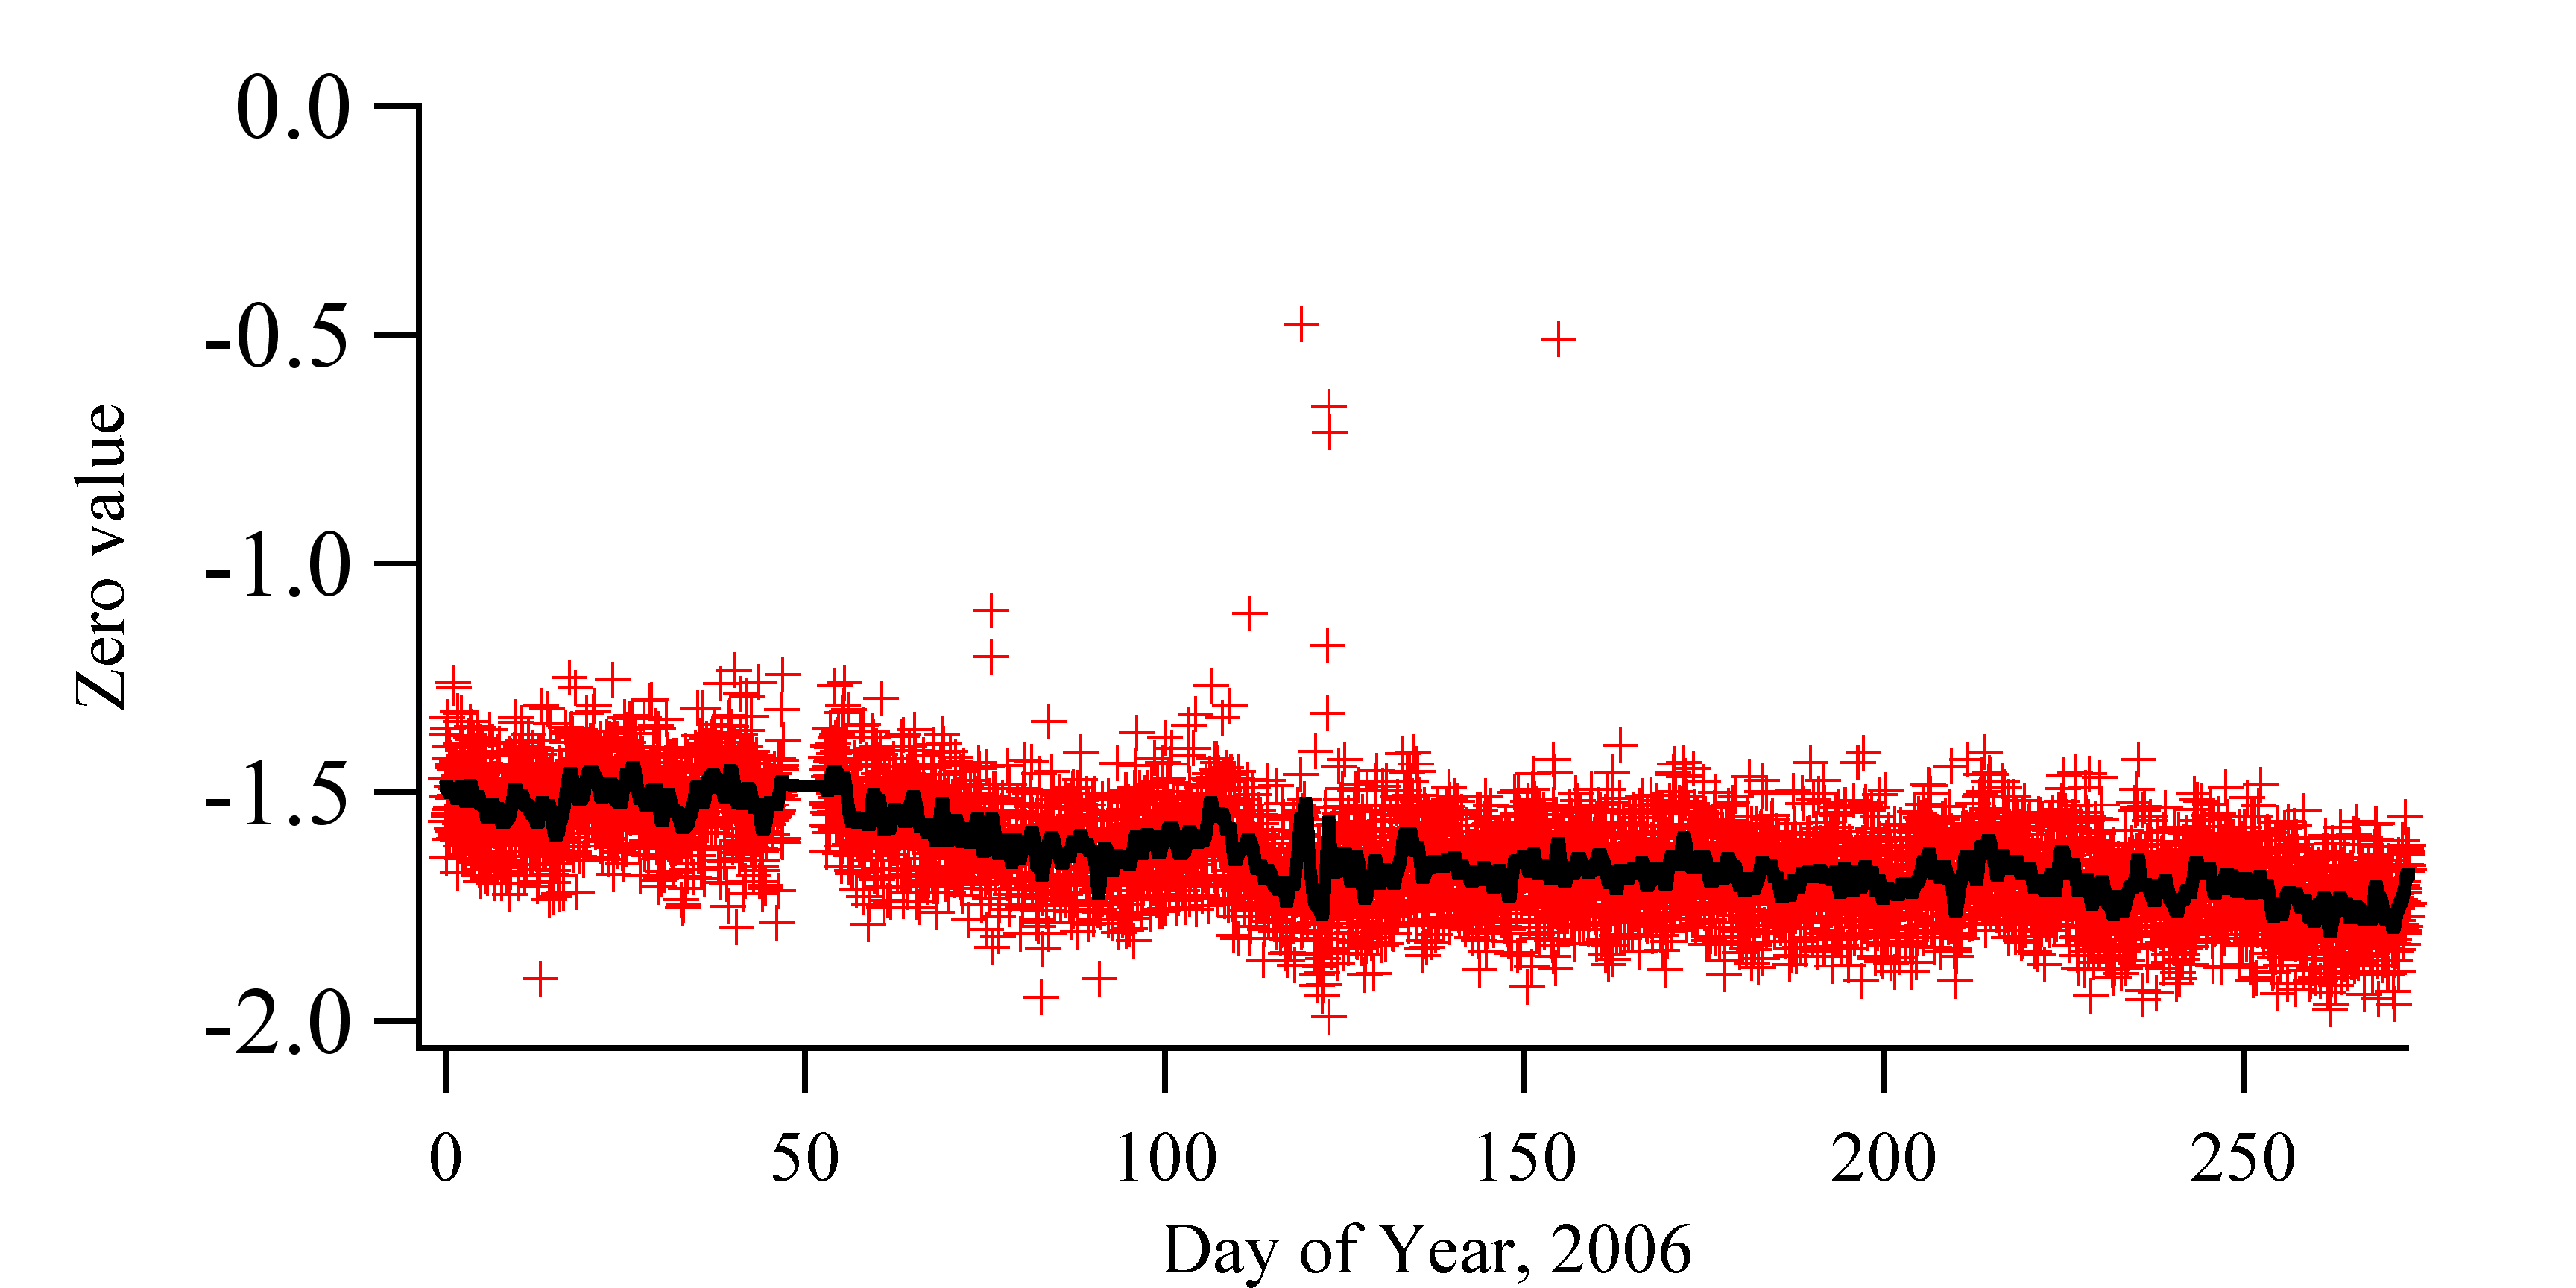
Data exists from January through September. In September the instrument failed, and it took a long time to get the system up and running again. When looking at the zeros there are many instances where the zero values are significantly greater than zero. These are indicative of a problem with the nephelometer being too hot. To work up the zeros we deleted all data with counts >50, then did a 100 point smooth. The original data and smoothed data are shown below.
2008
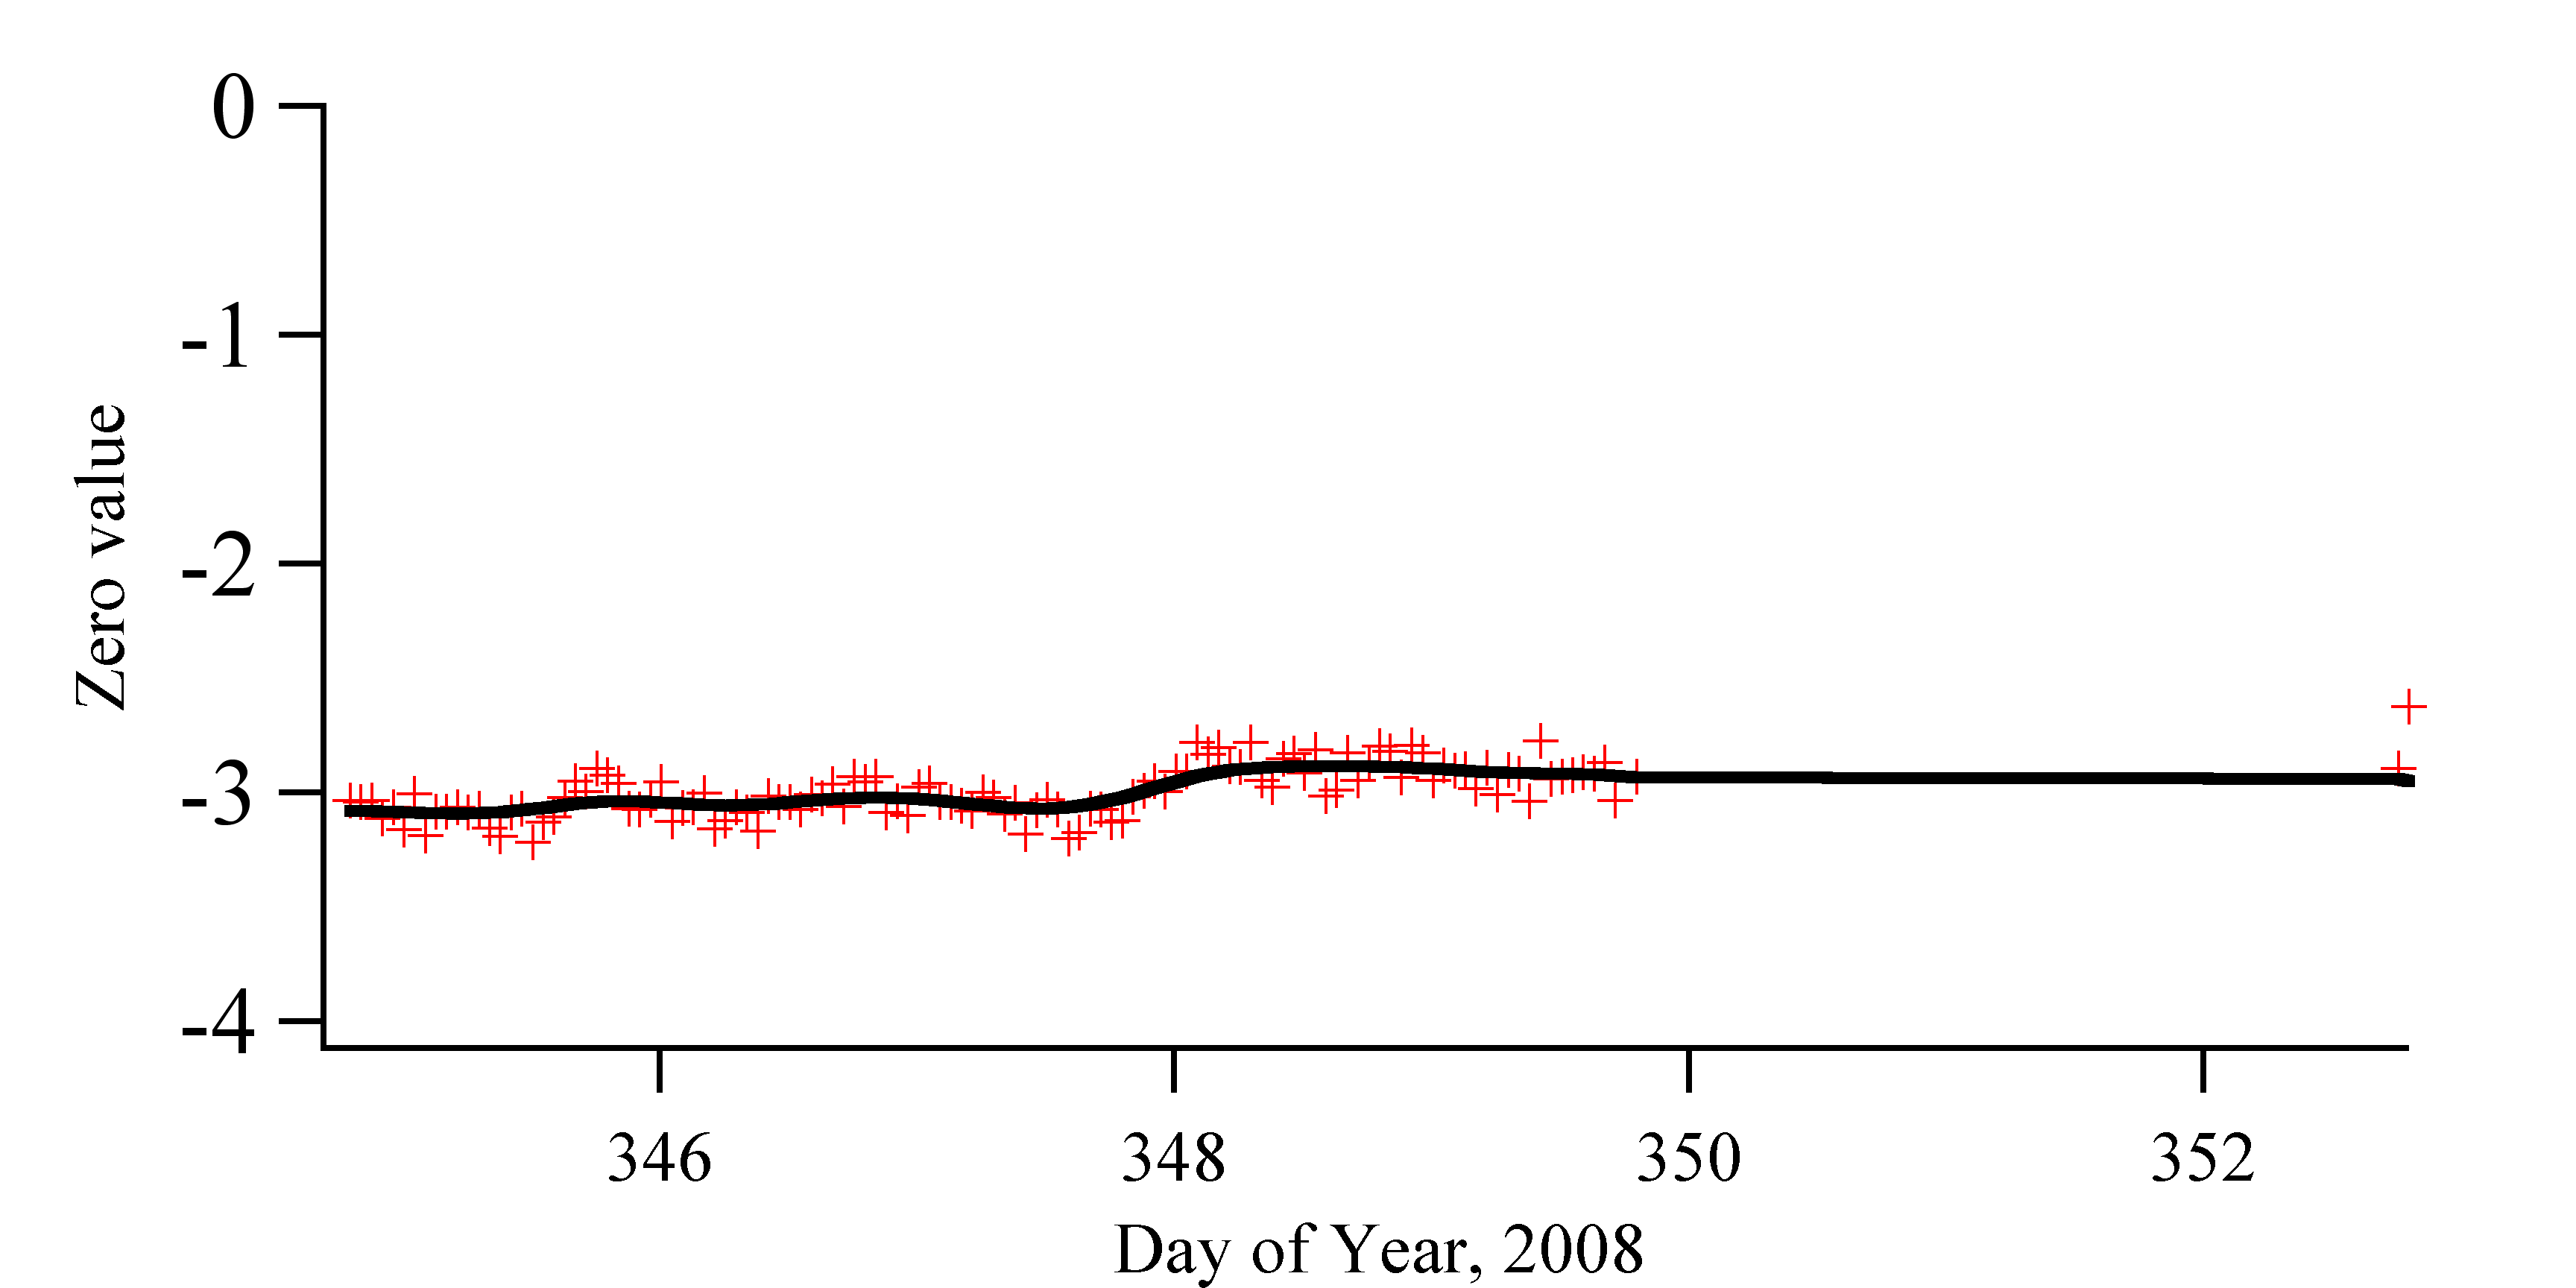
During 2008 most of the year, the instrument did not work for various reasons. We finally got the instrument working again in December. Below is the zero values for this period. Note this is a completely different instrument, hence the zero value is significantly different than on the earlier years.
2009
This is the current up to date data for 2009. It is through the end of June and of project.

Cal Value
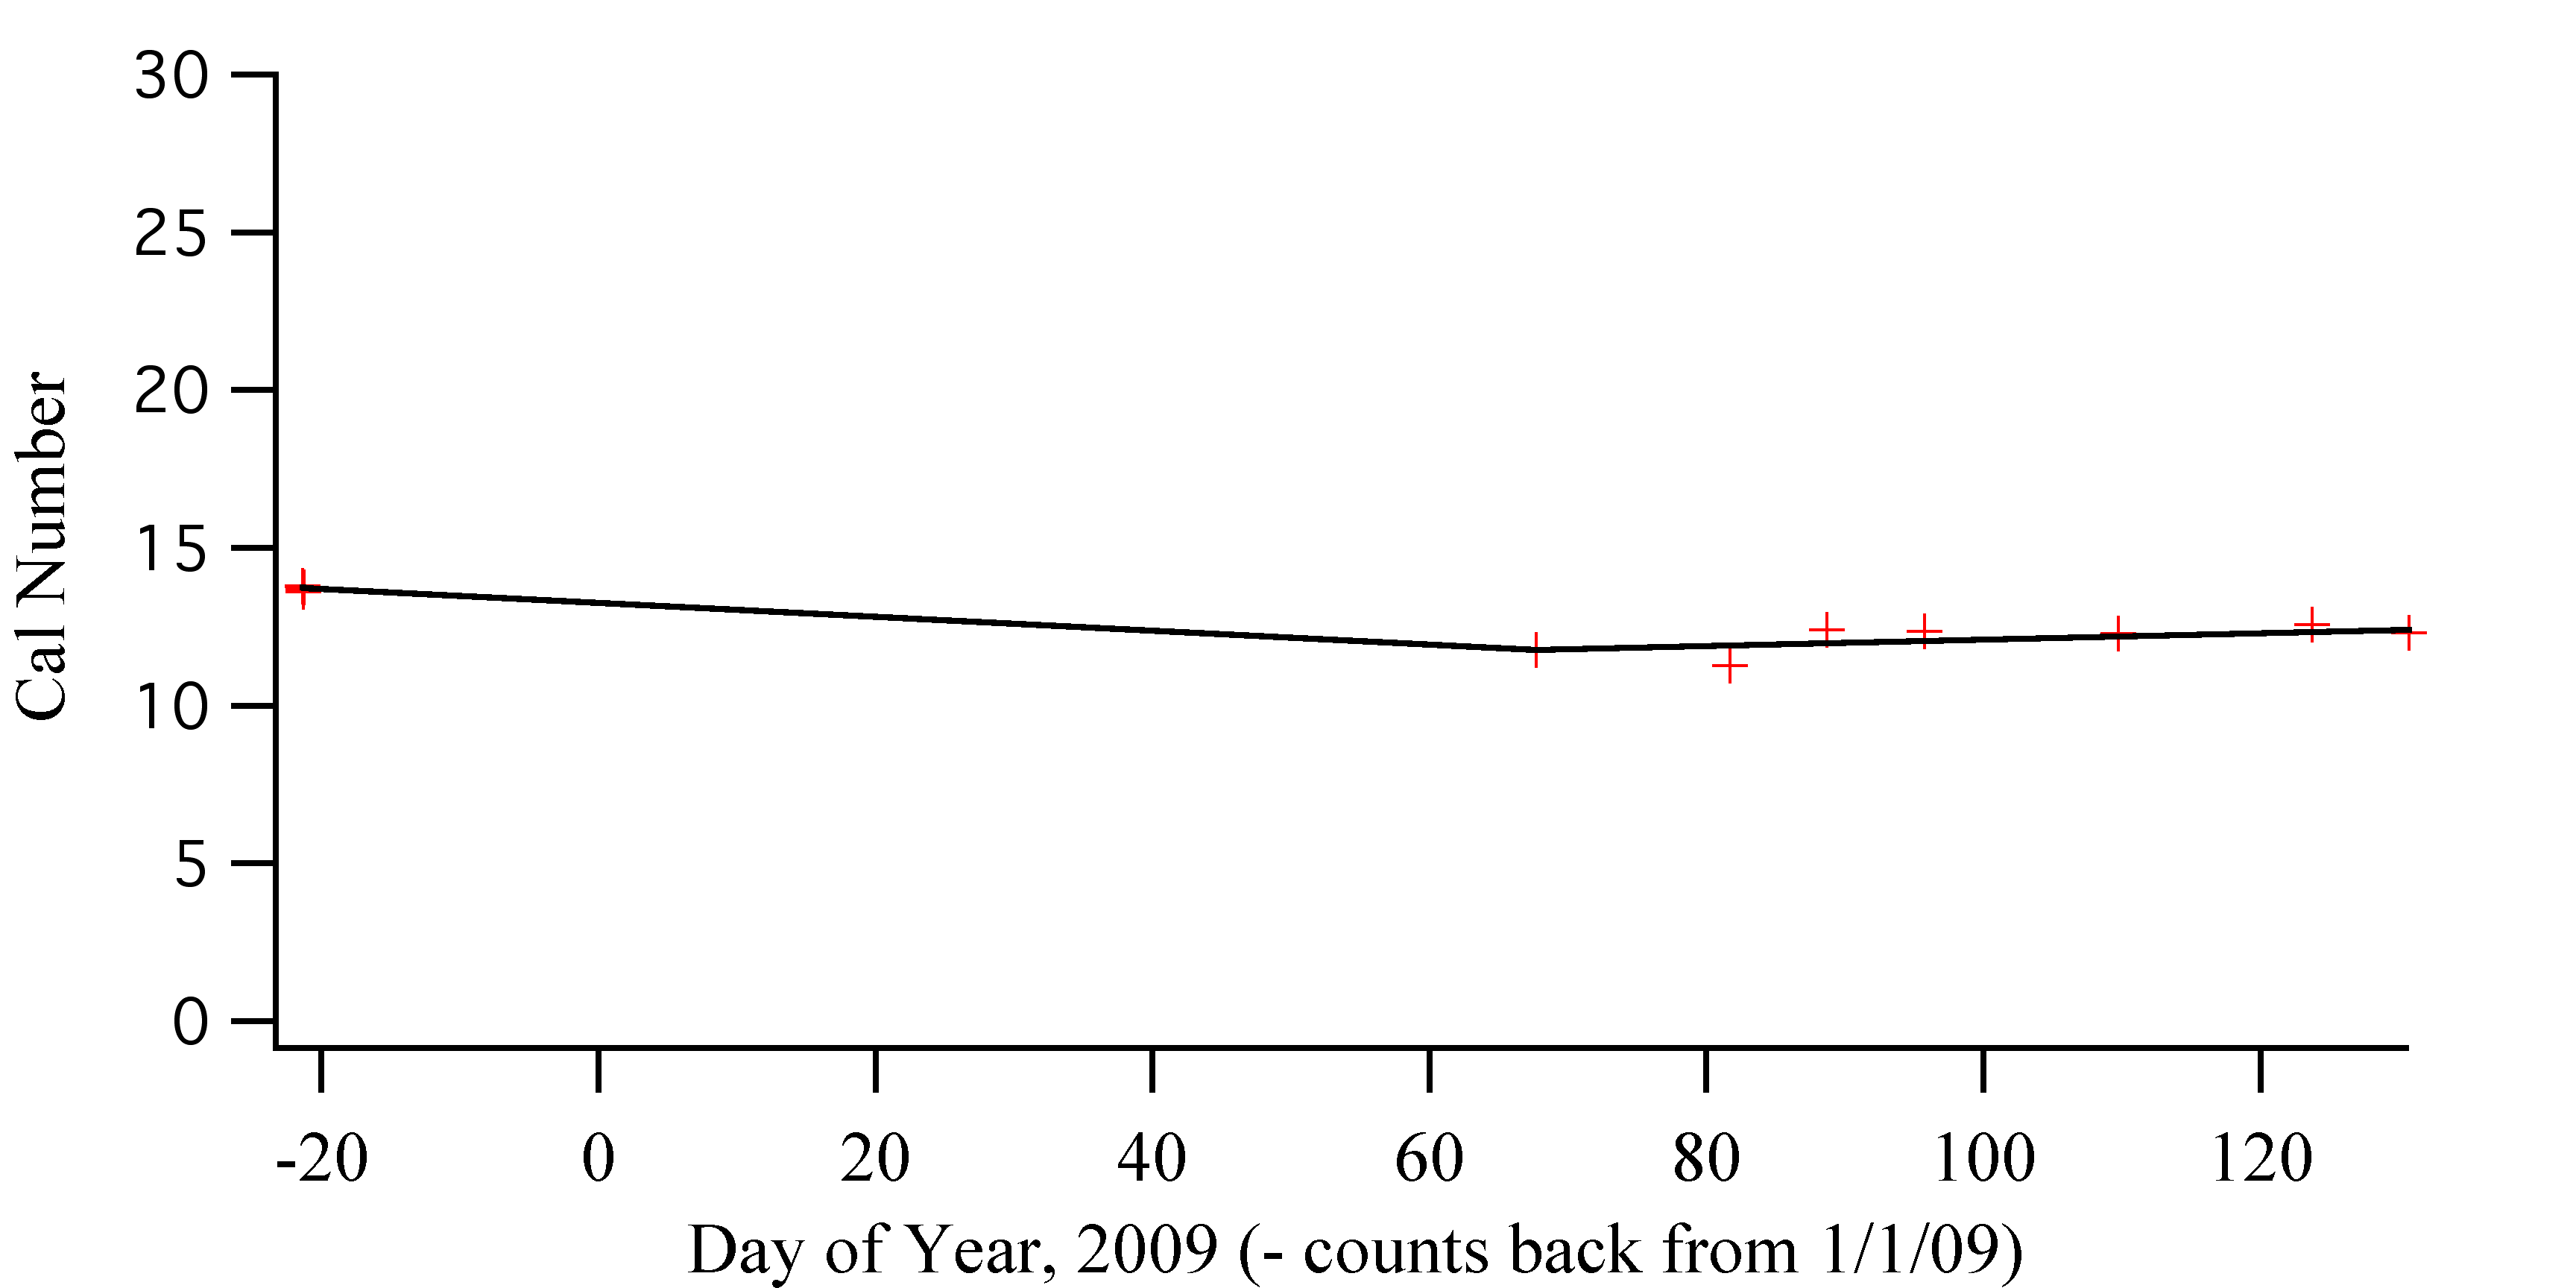
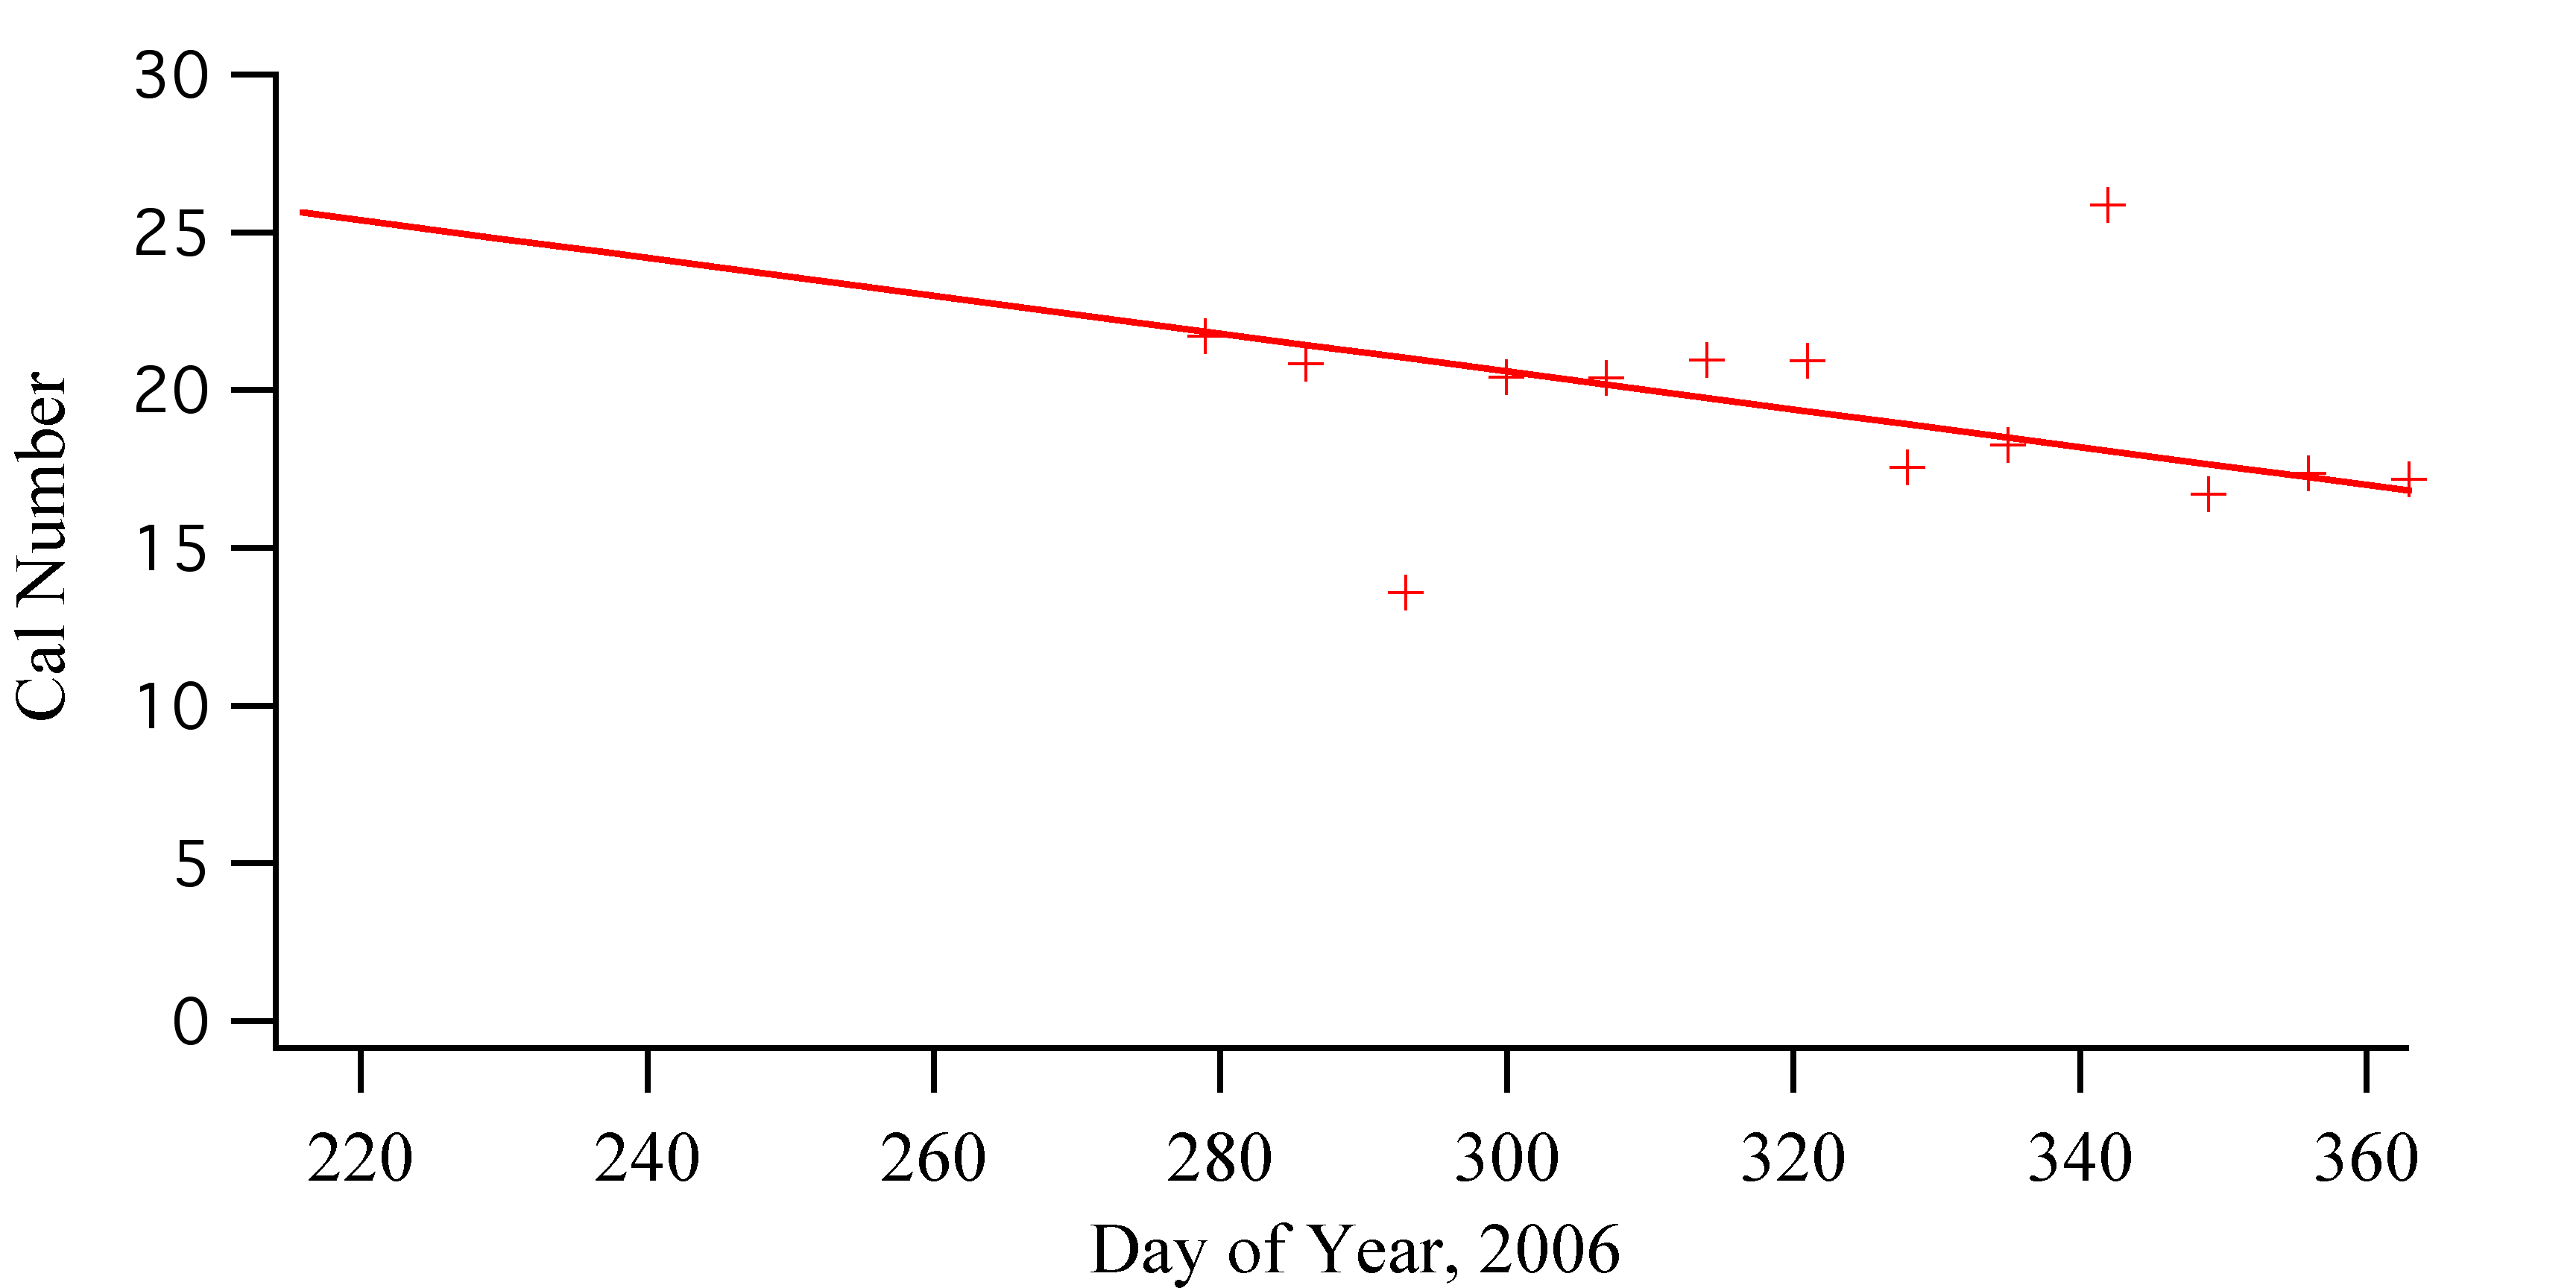
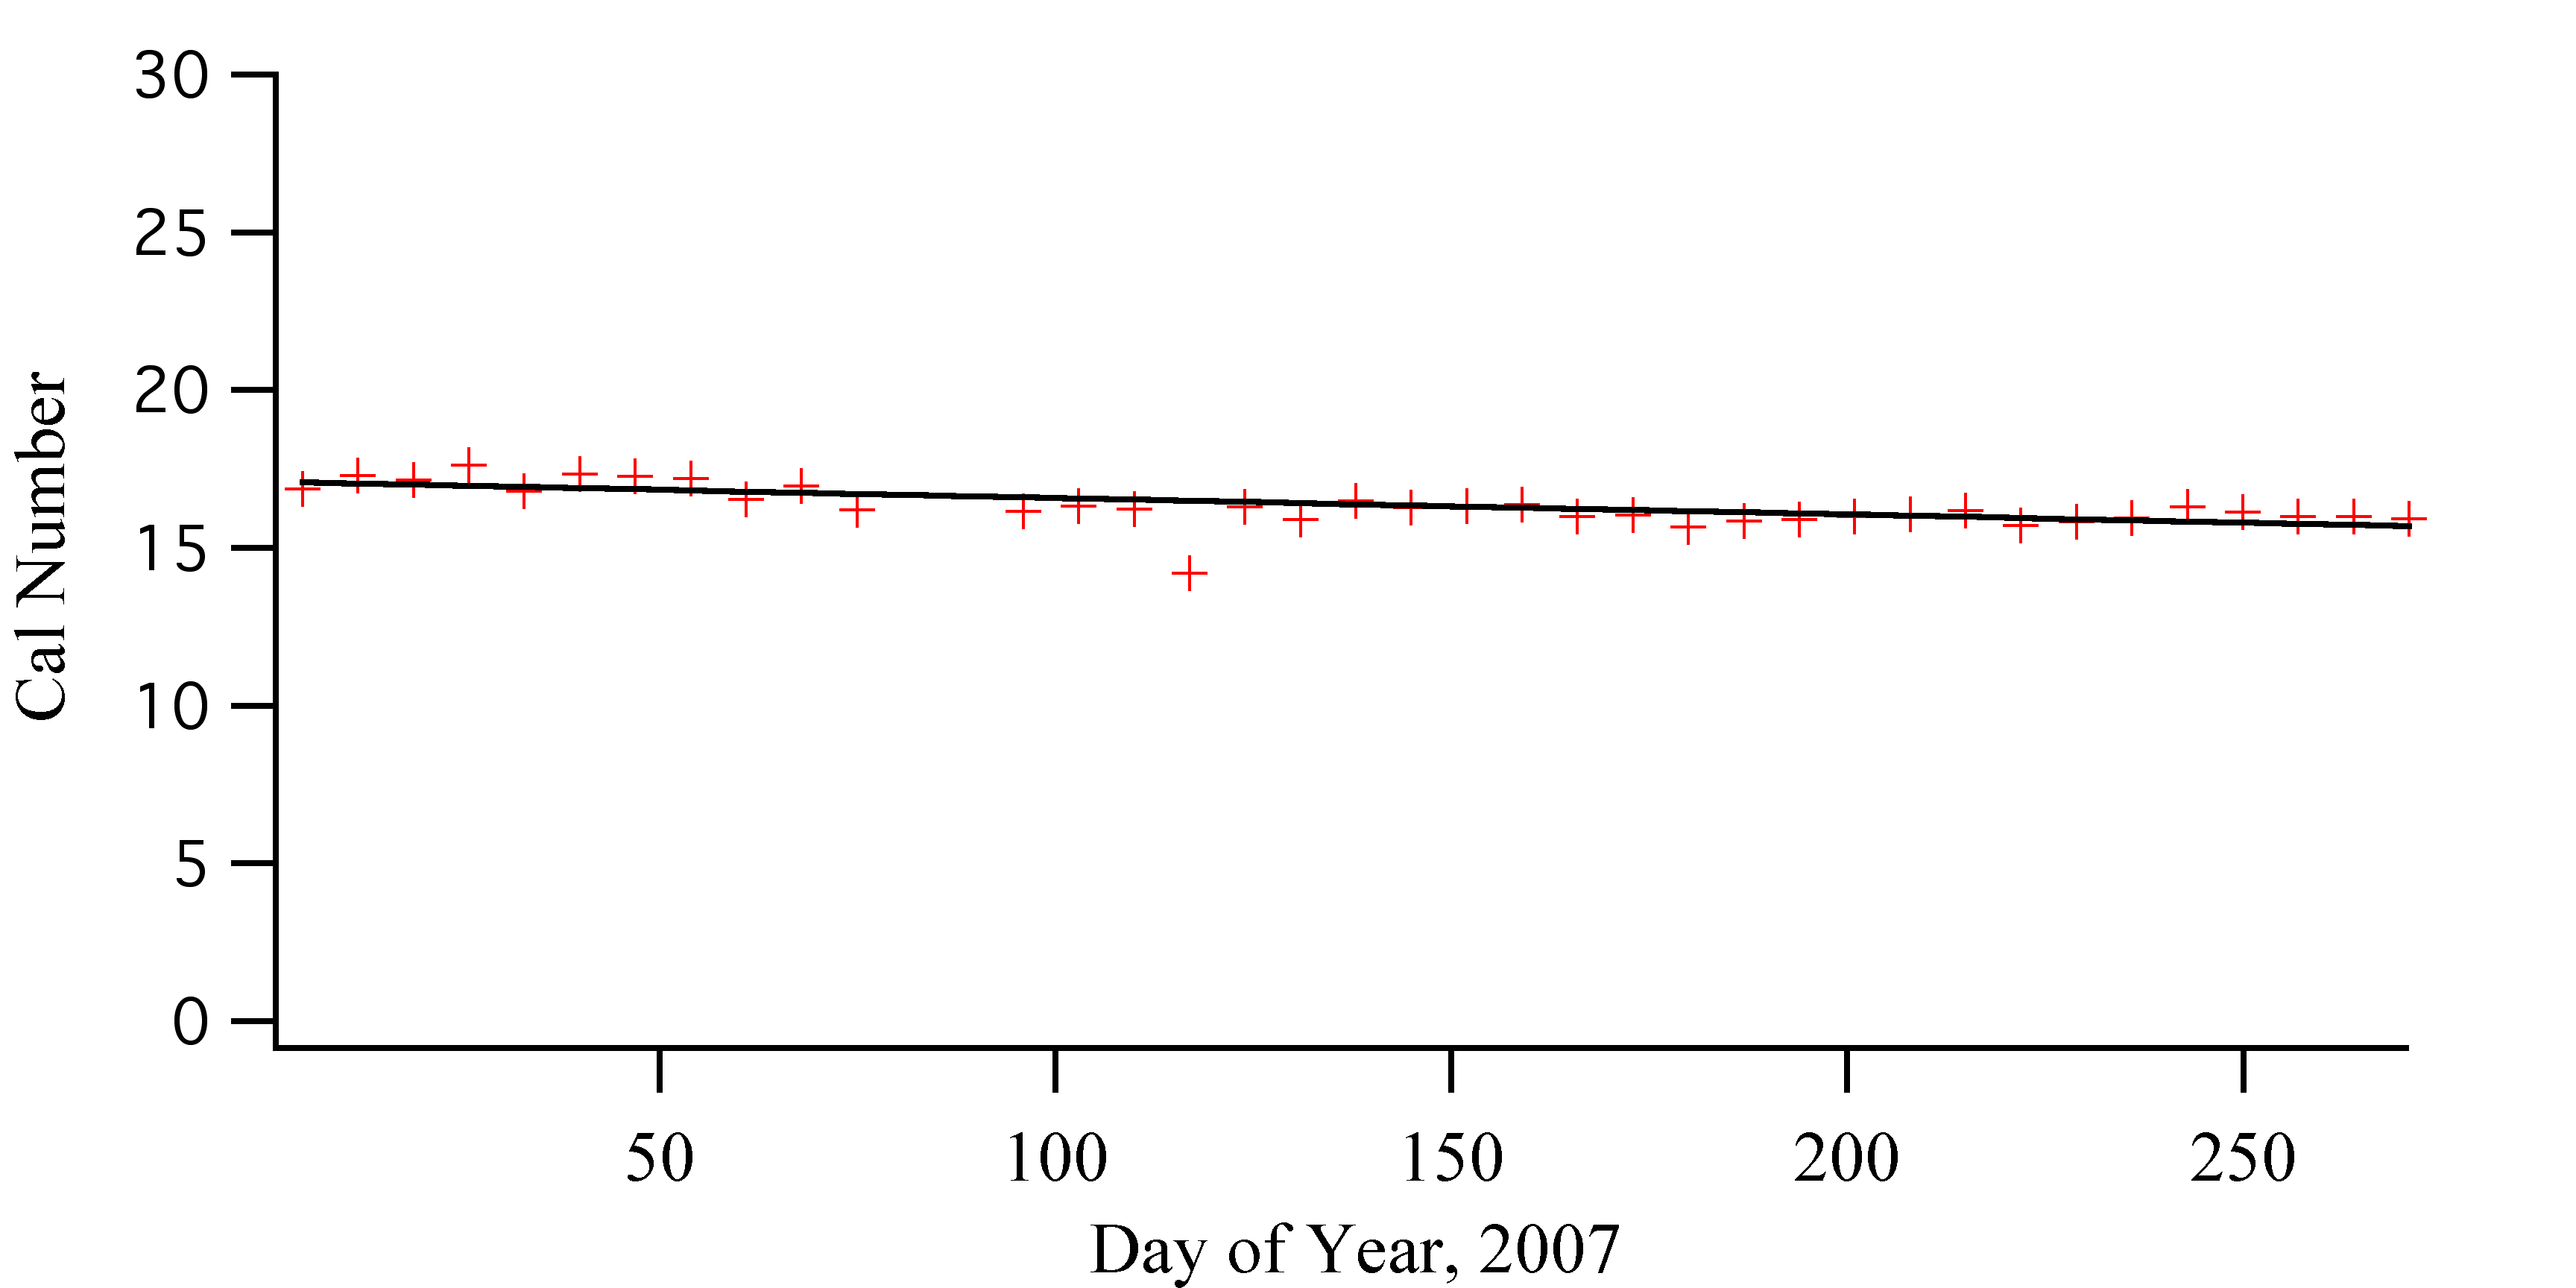
This analysis will handle each year separately. We have slightly different strategies for each year depending on what seems to fit the cal data the best. In the following graphs, the line is the fit used to reduce the data, the crosses are the individual calibration data points.
2006
Here a linear fit of the data seemed to do the best job at interpolating the different cal values. So a single linear fit over the entire period was used.
2007
Once again, a single linear fit over the entire period of data was used. This appears to be a reasonable smoothing of the calibration data.
2008-2009
During this period there are basically two linear fits, the period up to day 60 and the period after day 60. Otherwise things look pretty good. The calibration air tank ran out in June, so there are no calibration points during June.
